
From address to finished CMA
in seconds.
No file exports. No manual sorting. No staring at listings one by one. Enter an address, review ranked comps pulled straight from your MLS, and generate your narrative — start to finish.
Enter the subject property address
No export, no file, no login to your MLS. Just type the subject property's address into CMADraft — that's the only input required.
This only works for agents at brokerages we've actually set up on a licensed MLS data feed. If your brokerage isn't approved yet, have them reach out. Get your brokerage set up.
Subject Property
That's it — sqft, beds, baths, and year built are looked up automatically. Illustrative sample, not a real property or transaction.
Comps are pulled automatically
CMADraft looks up nearby sold listings straight from the licensed MLS feed — address, sold price, sold date, square footage, beds, baths, and year built are all already there. No column mapping, nothing to fix.
Because the data comes directly from an official feed instead of a manual export, there's no formatting to reconcile between different MLS platforms — it's already structured the same way every time.
Review ranked comps and select your best
CMADraft scores every nearby sold listing against the subject property and returns a ranked list. Your best comps are at the top. Review the scores, see the supporting data, and select your final 2 to 6 comparables.
This is what replaces 30 to 60 minutes of manual sorting. Instead of eyeballing listings one by one, you see every candidate ranked by composite similarity — and you can immediately tell which ones to use.
Ranked comp results — scored and sorted by similarity
Every nearby sold listing scored simultaneously. Best matches at the top — select your final 2 to 6 and generate the report. Illustrative sample, not a real property or transaction.
Select Your Comps
Top 20 ranked candidates for 101 Sample Street, Your City
3 of 6 selected
Choose 2-6
123 Main St, Your City
3bd · 2ba · 1,740 sqft · 1998 · Single Family
$412,000
Apr 2, 2026
94%
match
456 Oak Ave, Your City
3bd · 2ba · 1,810 sqft · 1995 · Single Family
$398,500
Mar 18, 2026
91%
match
789 Elm Ct, Your City
3bd · 2ba · 1,680 sqft · 2001 · Single Family
$425,000
Apr 14, 2026
88%
match
321 Pine Rd, Your City
3bd · 1ba · 1,620 sqft · 1994 · Single Family
$381,000
Feb 27, 2026
79%
match
88 Birch Blvd, Your City
3bd · 2ba · 1,900 sqft · 1996 · Single Family
$441,000
Jan 30, 2026
74%
match
210 Cedar Ln, Your City
4bd · 2ba · 1,780 sqft · 2000 · Single Family
$418,000
Feb 11, 2026
68%
match
Generate your CMA narrative
Once you've selected your final comps, CMADraft's AI writes a professional CMA narrative — a complete first draft covering each comparable, key differences, price per square foot range, and a pricing position summary.
The draft is yours to edit. Add your local market knowledge, adjust the pricing language, and put your name on it. Nothing goes to a client automatically — every word passes through you first.
Your finished CMA report — ready for the listing appointment
Subject property summary, selected comps with match scores, and an AI-drafted narrative — all in one view. Illustrative sample, not a real property or transaction.
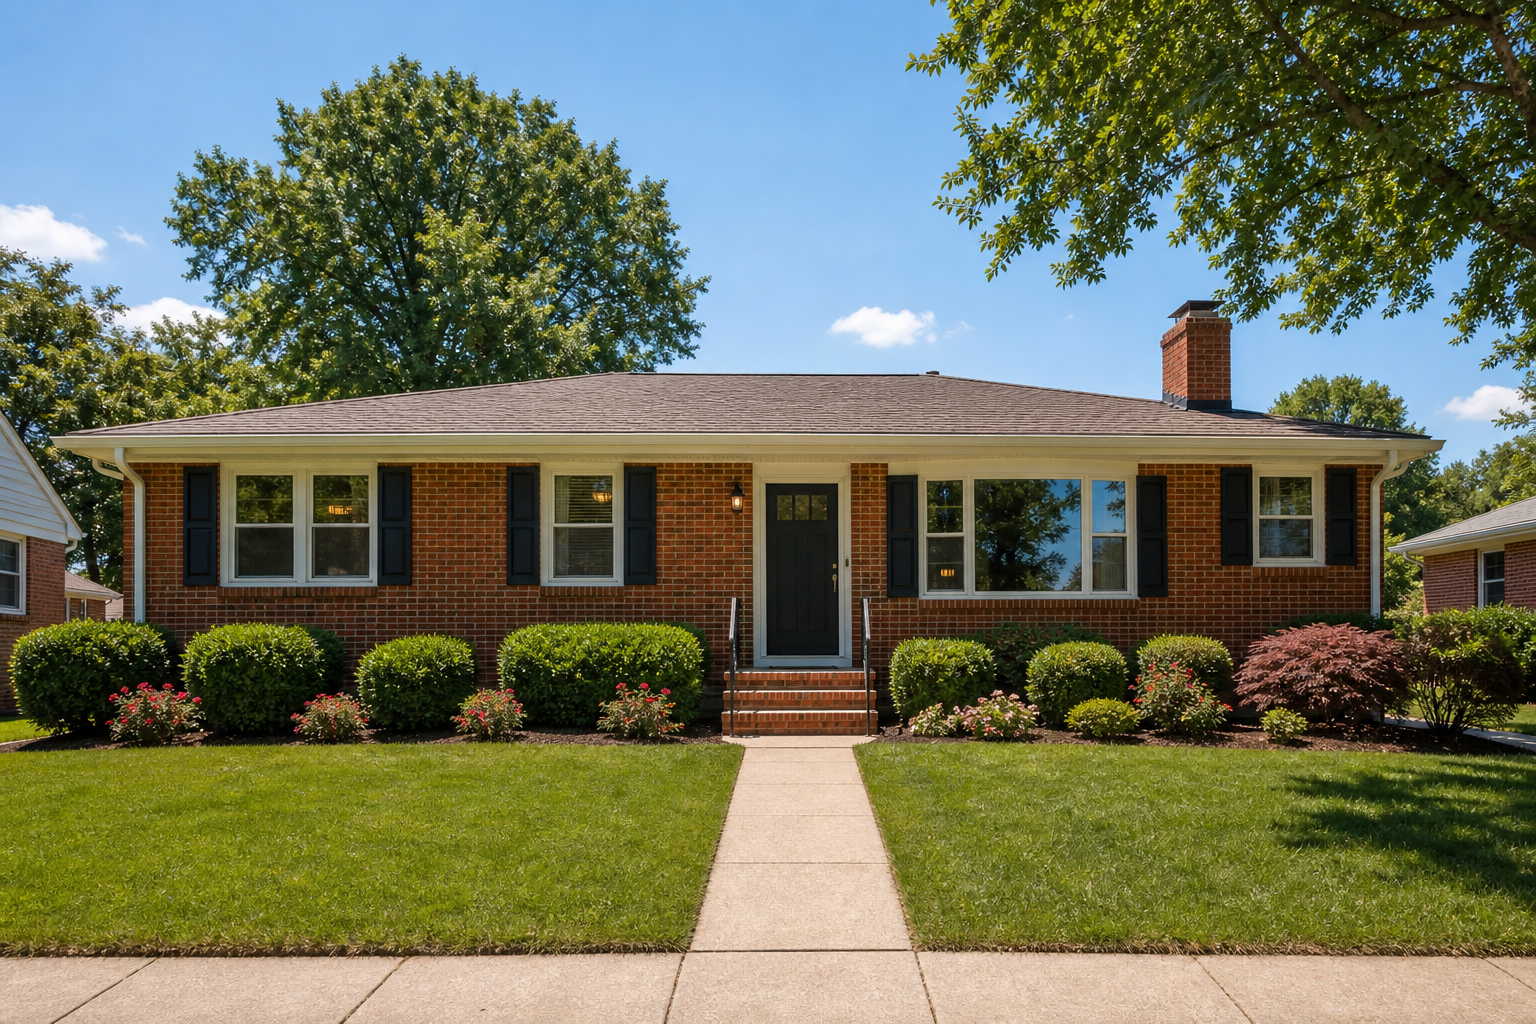
Subject Property
101 Sample Street, Your City
3 beds · 2 baths · 1,750 sqft · Built 1999
$412,000
Avg Sold Price
$237/sqft
Avg Price/Sqft
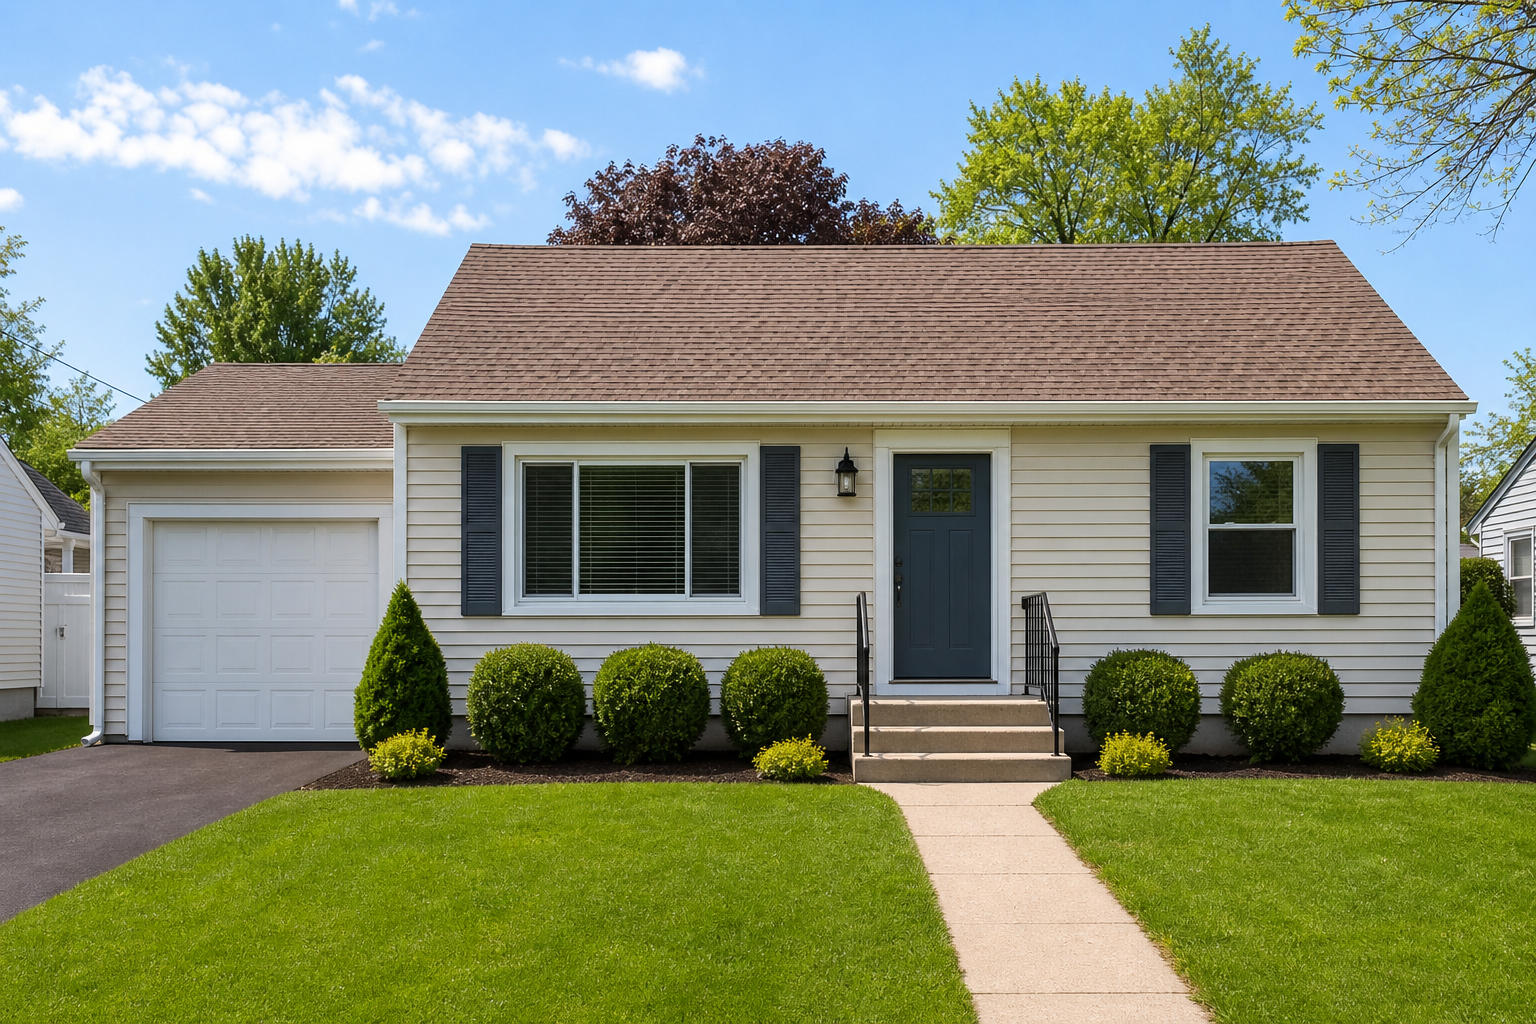 1
1123 Main St
Your City
Match Breakdown
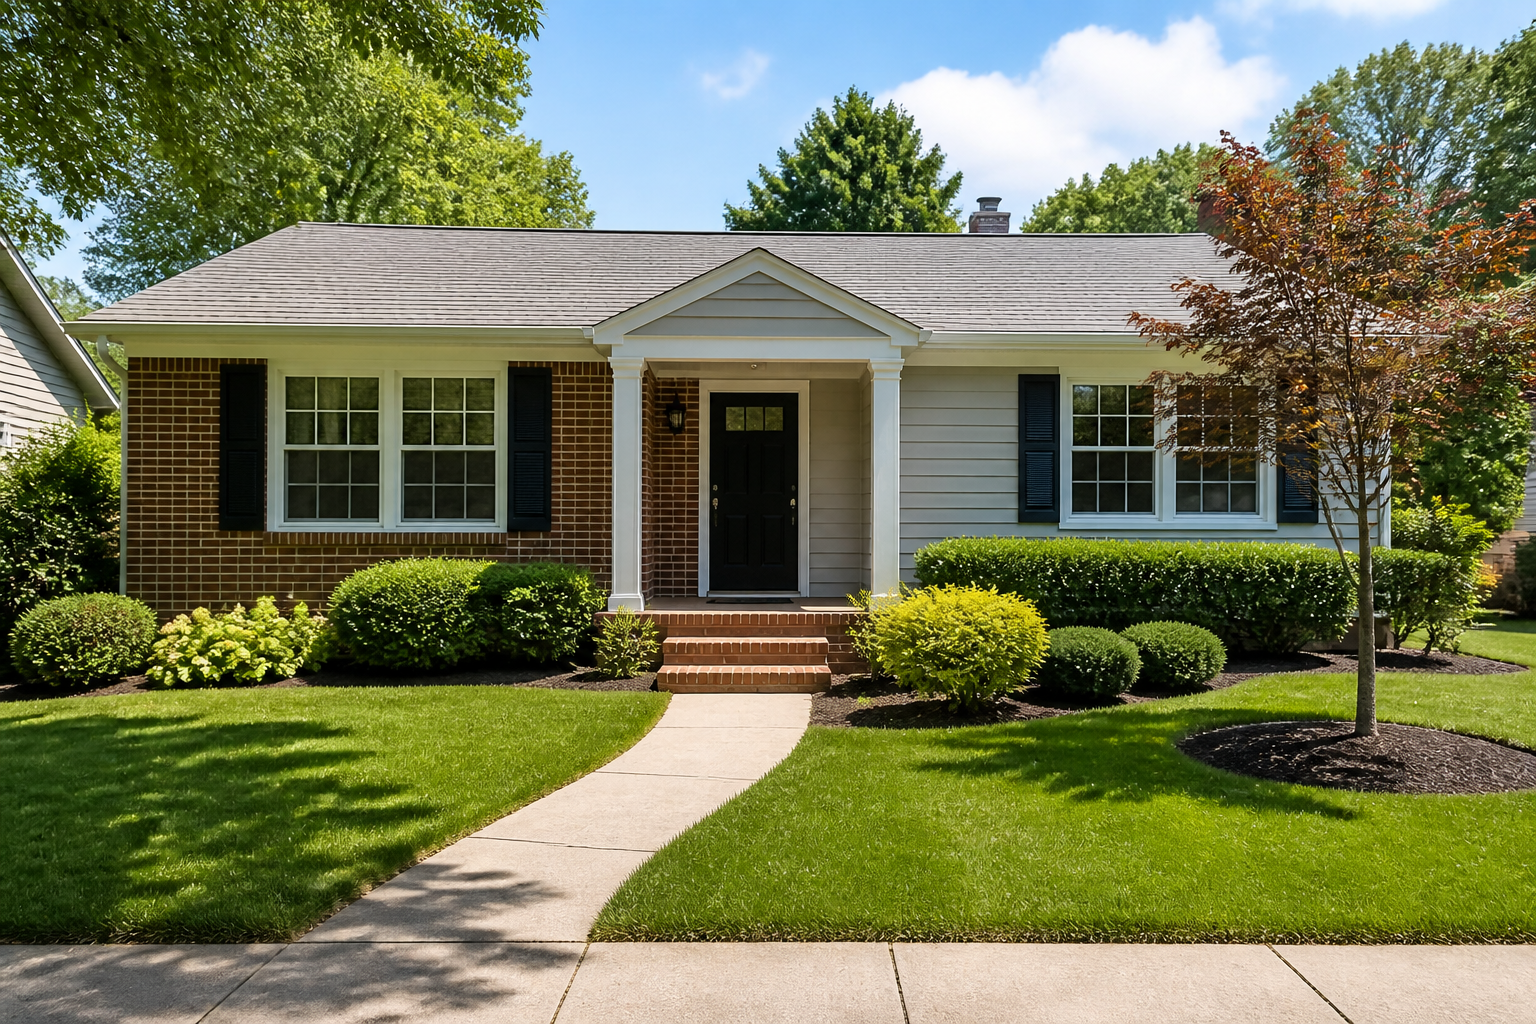 2
2456 Oak Ave
Your City
Match Breakdown
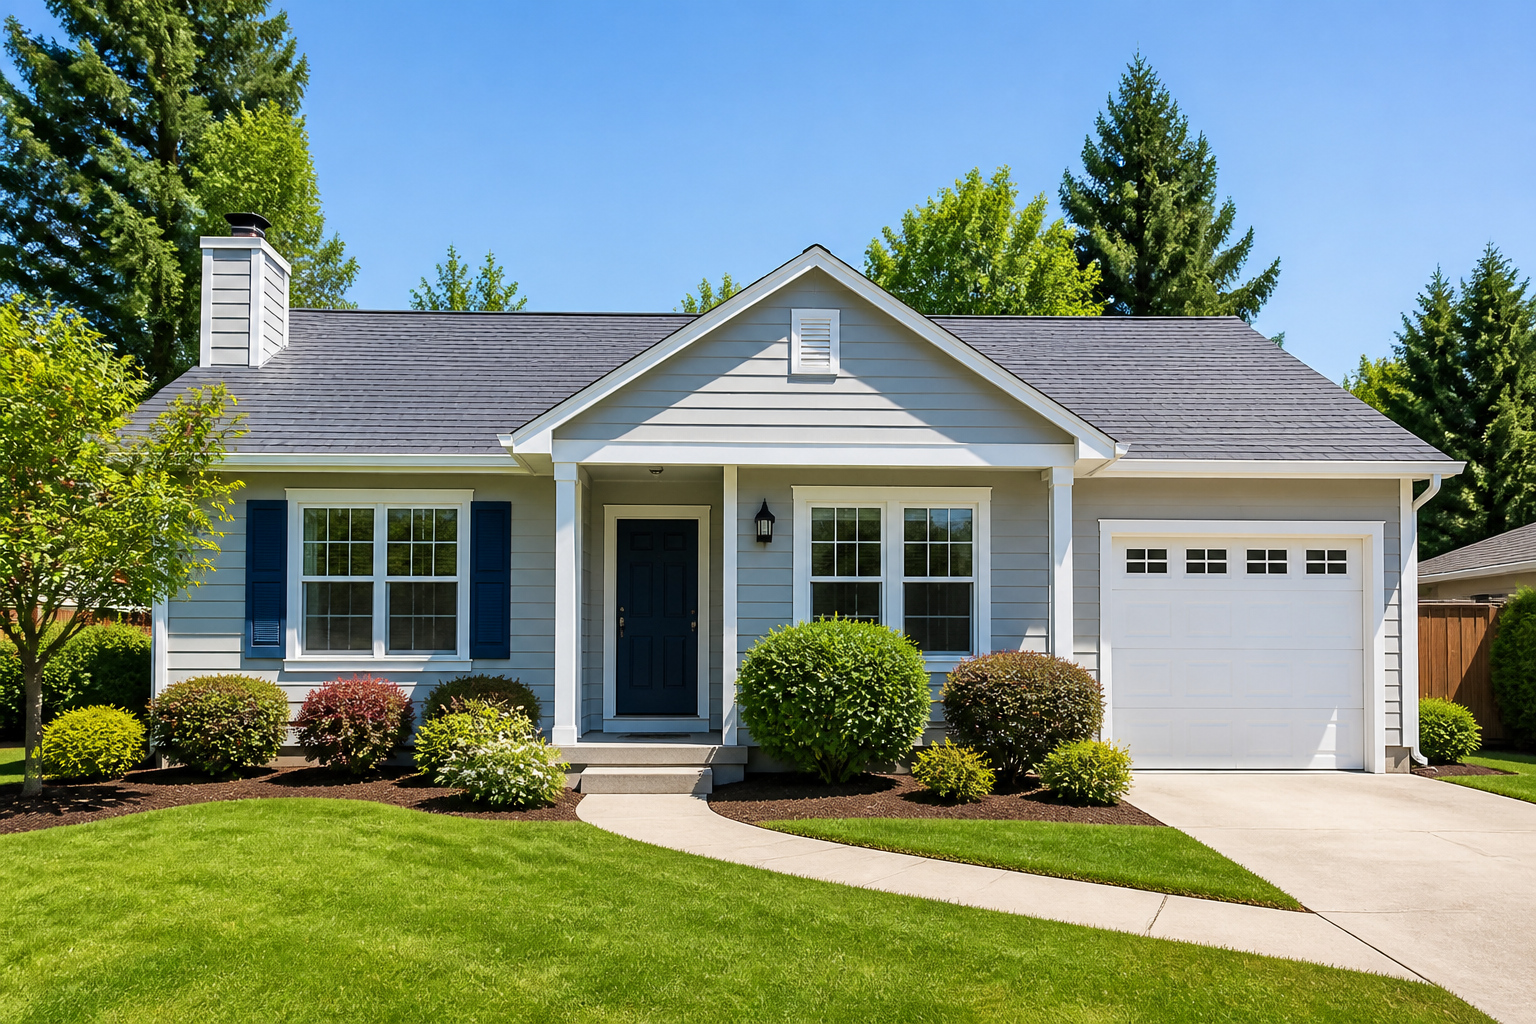 3
3789 Elm Ct
Your City
Match Breakdown
In preparing this comparative market analysis, the selected comparables — 123 Main St, 456 Oak Ave, and 789 Elm Ct — were chosen based on proximity, similarity in property features, and recent sales activity. All three are located within a 0.2-mile radius of the subject property, ensuring consistent neighborhood conditions and market dynamics.
The collective data suggests a stable market for properties of this size and configuration, with sold prices ranging from $398,500 to $425,000 and an average price per square foot of $237. The subject property at 1,750 square feet aligns closely with all three comparables in bedroom count, bath count, and build year. Agents should consider condition adjustments and any recent improvements when positioning the final list price within this indicated range.
What CMADraft scores — and why
Every nearby sold listing gets a composite similarity score based on six factors. Each factor reflects a real buyer and appraiser decision — not arbitrary weighting.
How far each comp is from the subject property. Closer comps carry more weight — proximity is the strongest predictor of relevance.
The difference in living area between the comp and subject. A 1,800 sq ft home scores a 1,750 sq ft comp higher than a 2,400 sq ft one.
Buyers searching 3-bedroom homes compare against other 3-bedroom homes. Bedroom match is a fundamental comp qualifier.
Full and half baths are factored separately. A 3/2 subject scores a 3/2 comp higher than a 3/1 or 3/3.
Single family, condo, townhome, and duplex are scored separately. Cross-type comps are ranked lower automatically.
A sale from 30 days ago is more market-relevant than one from 8 months ago. CMADraft weights recent solds higher to reflect current conditions.
What you walk away with
Every comp report includes everything you need for a listing appointment — nothing you need to build yourself.
Ranked comparable sales table
Every nearby sold listing scored and sorted. Address, sale price, distance, square footage, days on market, and similarity score — all in one view.
Price per square foot analysis
Implied $/sqft range across your selected comps, calculated automatically. Gives you an instant sanity check on any price position.
AI-drafted CMA narrative
A complete written first draft covering each comp, key differences from the subject, market context, and a pricing position summary. Yours to edit before it reaches a client.
PDF export
Export your finished report as a branded PDF. Attach it to your listing presentation, email it to the seller, or upload it to your CRM.
Ready to run your first comp report?
Free plan includes 5 comp reports per month. No credit card required. Your next listing appointment starts here.